
In 2008, the Nottinghamshire Biodiversity Action Group resolved to produce a Biodiversity Opportunity Map (BOM) for the entire county. Opportunities identified by the BOM underpin the wider work of the partnership, and will help to enhance the biodiversity of Nottinghamshire.
How does it work?
Completing the BOM is no small feat. There are multiple steps involved in creating a Biodiversity Opportunity Map for Nottinghamshire.
Step 1: Updating the Phase 1
The first step in the BOM process is to update the Phase 1 habitat map. A Phase 1 habitat survey is a standardised system for classifying and mapping habitats in an area.
In 1998, a Phase 1 habitat survey was undertaken across Nottinghamshire. The results of this survey are held as a paper record by the Nottinghamshire Biological & Geological Records Centre (NBGRC). In order to create the BOM, the Phase 1 data must be digitised so it can be incorporated into GIS (Geographic Information System). This is a three stage process, involving scanning the original paper maps, geo-rectifying each scanned tile, and then transferring the Phase 1 data into a digitised form.
The Phase 1 data is built upon a base-layer that uses Ordinance Surveys MasterMap. A Phase 1 habitat code is given to each polygon, or "land parcel", identifying which habitat type it correlates with. This can be a lengthy process, depending on depending on the size of the area being mapped and also the average size of the polygons.
The newly digitised Phase 1 map is then brought up to date using aerial photography, Local Wildlife Site data (supplied by NBGRC), and any other relevant data sources (e.g. SSSI data, ancient woodland inventory data, etc).
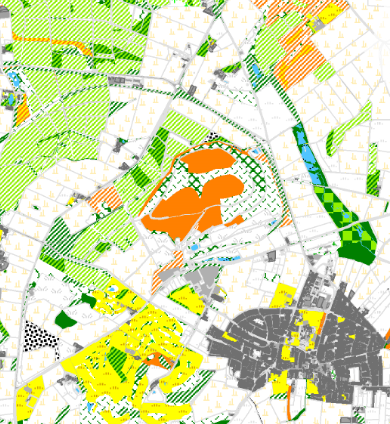
Digitised Phase 1 map: Calverton

Woodland connectivity map: Calverton
Step 2:Using the Habitat Network Model to create habitat connectivity maps
The second step of the BOM is to establish how well connected the existing habitat resource is across the landscape. In order to do this, the BOM uses a Habitat Network Model developed by the National Forest Company.
This model assigns a permeability value to each Phase 1 habitat type. The permeability values are based on the work of Roger Catchpole at Natural England and have been slightly modified to reflect Nottinghamshire circumstances. His work looks at how far a focal species can move from its core habitat through the wider landscape. Core habitat types are areas of high biodiversity value that are able to support a wide range of associated species. For example, the phase 1 habitat types broadleaved woodland - plantation (PBW), broadleaved woodland - semi-natural (BW), mixed woodland - plantation (PMW), and mixed woodland - semi-natural (MW) are considered core habitat for the broad habitat type of woodland. The model then creates a habitat connectivity map for four the broad habitat types; woodland, acid grassland and heathland, other grasslands, and wetland.
The Model uses “least cost analysis” to calculate how far the focal species can move from its core habitat. Species moving further through more permeable habitats than through less permeable ones; for example, the woodland focal species can move well through habitats that are similar to woodland, such as scrub, but not through habitats which are very different to woodland, such as arable farmland or grassland. Therefore, core habitats that are surrounded by more permeable habitats will allow for stronger networks than those separated by impermeable ones. Where areas of core habitat become linked, these are referred to as Habitat Networks.
To assist in the interpretation of this data, Habitat Networks have been placed into different categories depending on their size (which is the size of the Habitat Network, not the size of the core habitat contained within the Habitat Network), so that large Habitat Networks (containing areas of well connected habitats) can be distinguished from small Habitat Networks (representing isolated and fragmented areas of habitat).
The outcome of this step is a completed connectivity map for each of the four broad habitat types.
Step 3: Stakeholder workshops to identify biodiversity opportunities
The information generated by the Habitat Network Model is used to identify opportunities to enhance and improve biodiversity connectivity in a given landscape.
A workshop is held at which key stakeholders are invited to participate, and share their local knowledge to create the biodiversity opportunity maps. During the workshops, participants are asked to identify opportunities using the connectivity maps for each of the four broad habitat types. Opportunities are identified for two timescales - a long term 50-year period, and a shorter term 10 year period.
There are four key principles that are followed when creating areas of opportunity. These are set out in "Making Space for Nature"- Better, Bigger, More, Connected. "Better" opportunities pinpoint areas of existing habitat that have degraded over time and are in poor condition. "Bigger" opportunities identify areas which existing habitat can expand onto, buffering the resource from neighbouring land uses. "More" identifies areas of possible habitat creation. "Connected" refers to new habitat that acts as links between areas of existing habitat.
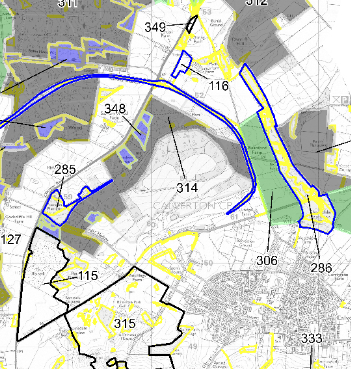
Opportunities for woodland: Calverton

Focal areas: Gedling
Step 4: Identifying focal areas
The habitat connectivity maps and the opportunity maps are used together to identify focal areas. A "focal area" can be defined as an area within which there are concentrations of existing habitats and opportunities. These may be confined to a river catchment or by a particular geological substrate, or cross a range of landscapes. In some cases, focal areas may focus on one particular habitat type, but more often than not will include benefits for multiple habitat types. These focal areas can be used to prioritise activities in a certain area, so that they have a maximum benefit for wildlife.
The BOM process has been undertaken in various parts of the county as and when funding has become available. A report has been produced for each area that summarises the outcomes. (Link to publications)